Telemetry Grapher
Introduction
Telemetry Grapher is a graphing application that allows for one or more telemetry points per graph. It supports multiple graphs per screen which can be resized and reordered. Multiple configurations can be saved and restored for different situations.
Telemetry Grapher Menus
File Menu Items
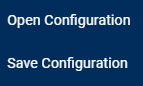
- Open a saved configuration (graphs and items)
- Save the current configuration
Open Configuration
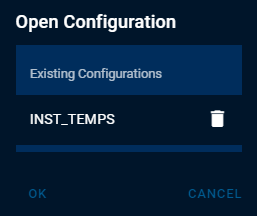
The Open and Save Configuration options deserve a little more explanation. When you select File Open the Open Configuration dialog appears. It displays a list of all saved configurations (INST_TEMPS in this example). You select a configuration and then click Ok to load it. You can delete existing configurations by clicking the Trash icon next to a configuration name.
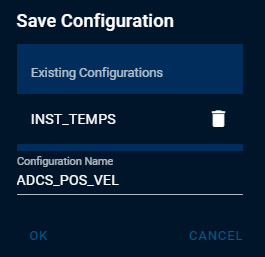
Save Configuration
When you select File Save the Save Configuration dialog appears. It displays a list of all saved configurations (INST_TEMPS in this example). You click the Configuration Name text field, enter the name of your new configuration, and click Ok to save. You can delete existing configurations by clicking the Trash icon next to a configuration name.
Graph Menu Items
- Add a new graph
- Edit the current graph
Editing the graph allows you to change the graph title among other items.
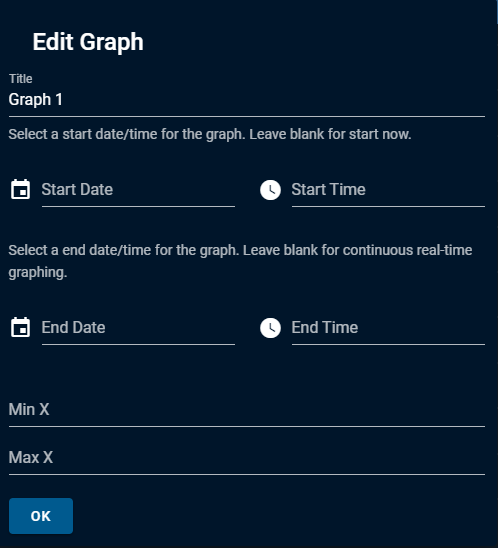
Editing the Start Date and Start Time will re-query the data to begin at the specified time. This operation can take several seconds depending on how far back data is requested. Similarly, specifying the End Date and End Time will limit the data request to the specified time. Leaving the End Date / End Time fields blank will cause Telemetry Grapher to continue to graph items in real-time as they arrive.
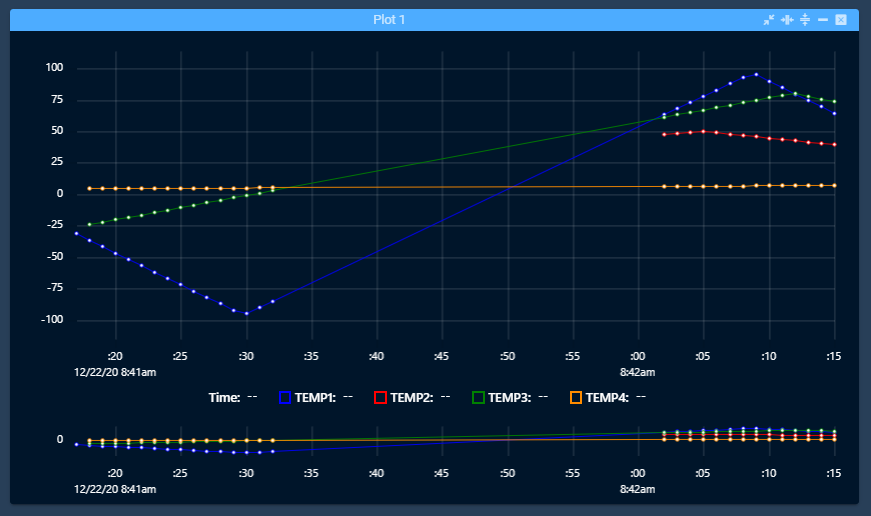
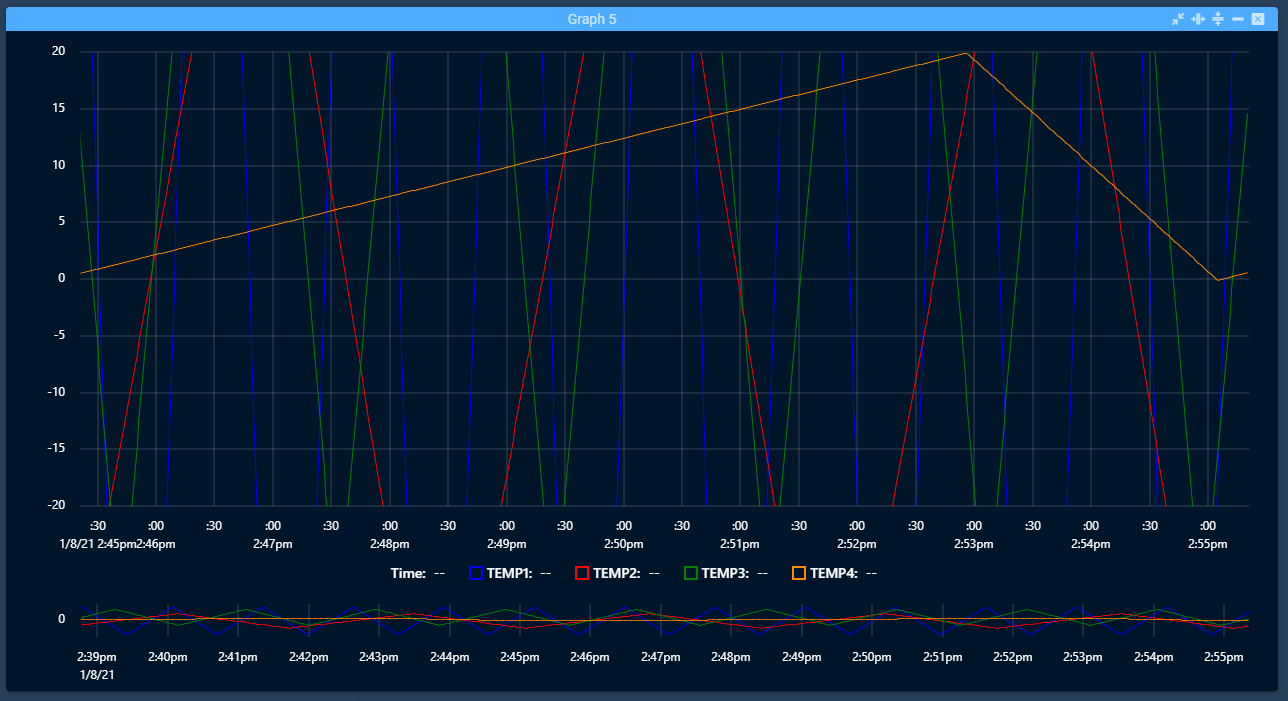
Changing the Min X and Max X values simply sets the graph scale. Deleting the Min X and Max X values allows the graph to scale automatically as values arrive. Compare the following graph with the minimum set to -20 and the maximum set to 20 with the first graph image (auto-scale).
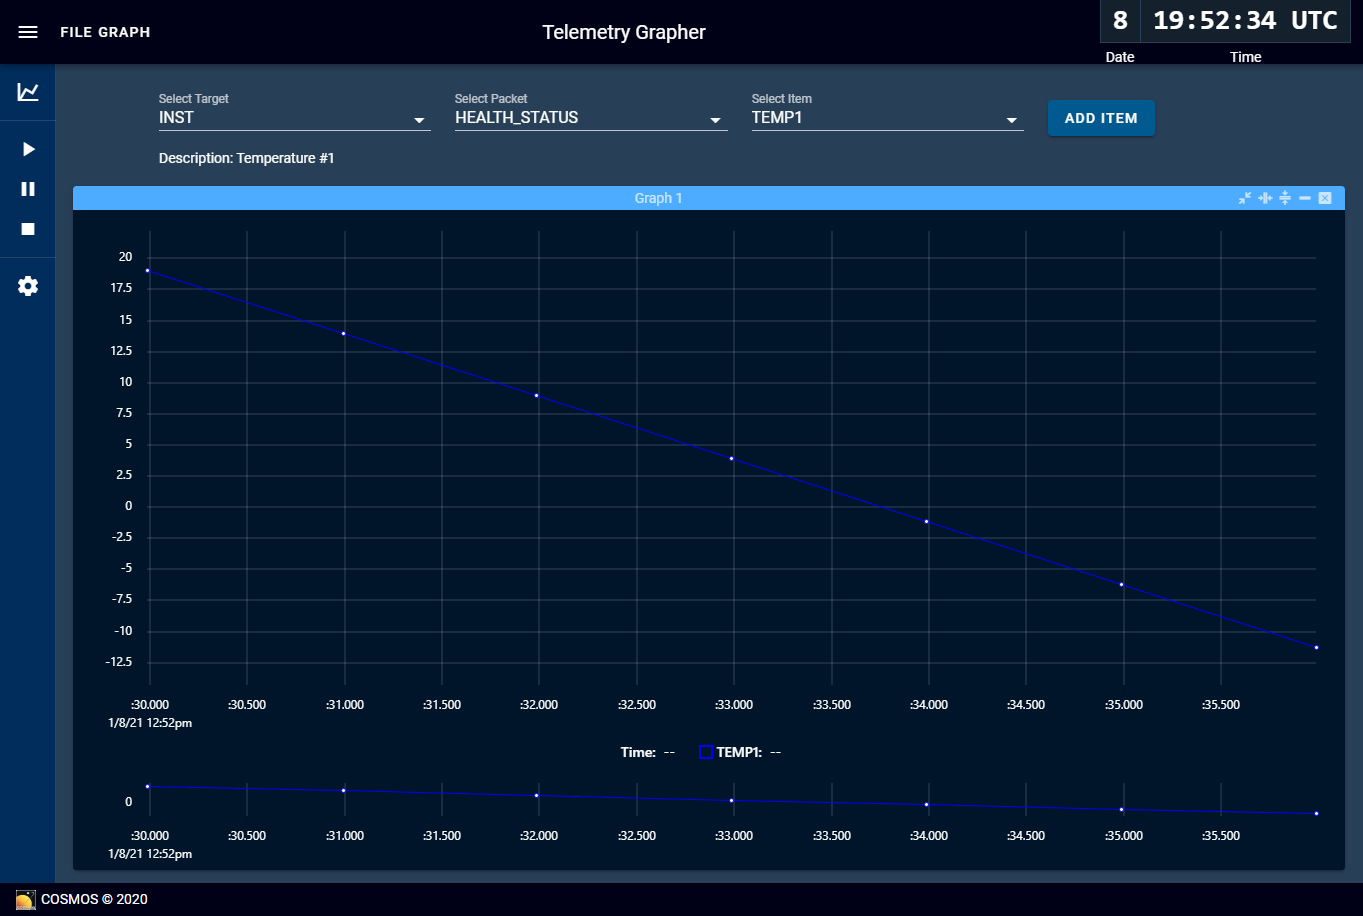
Selecting Items
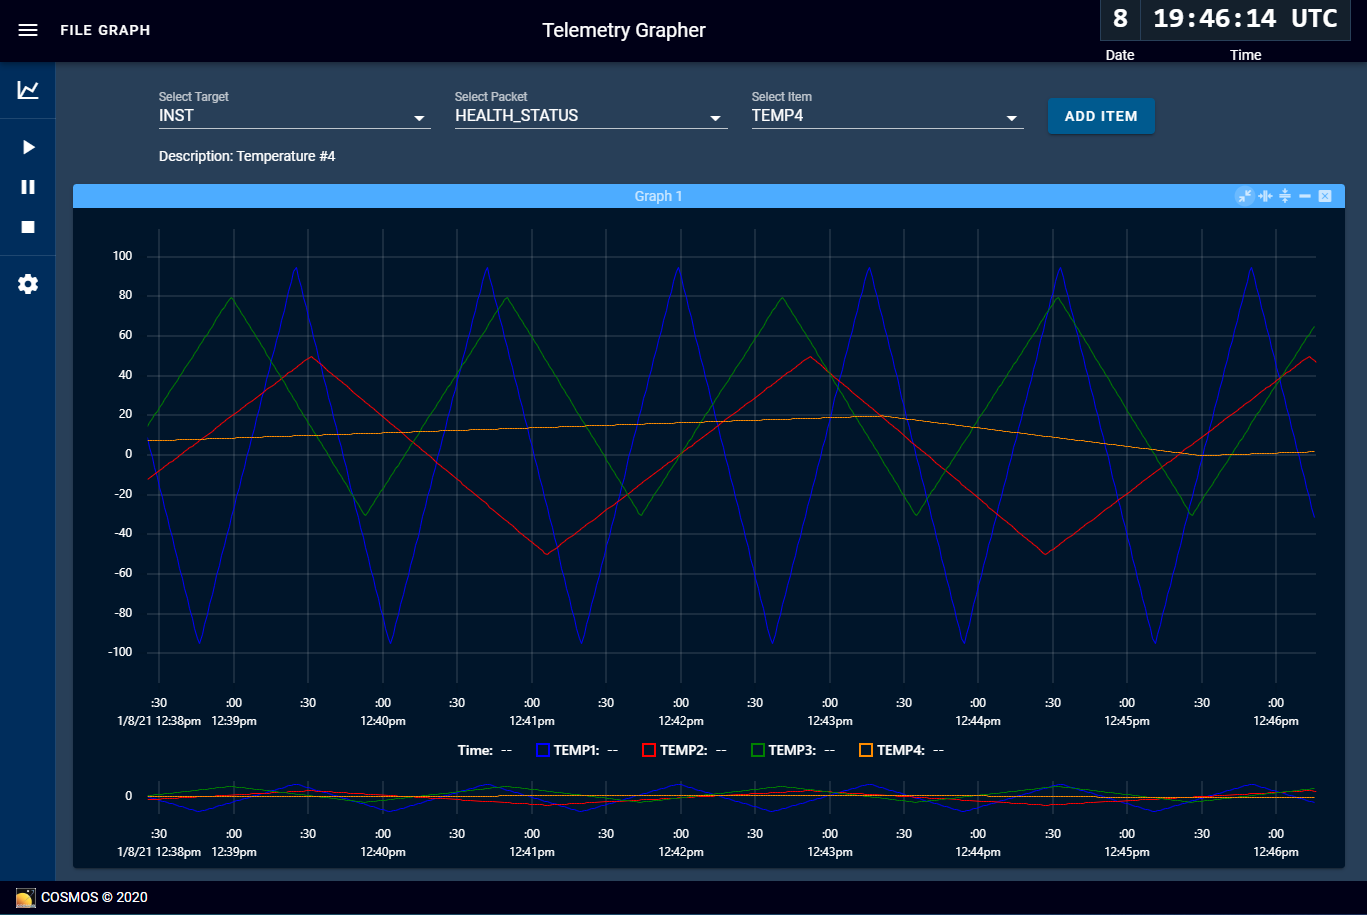
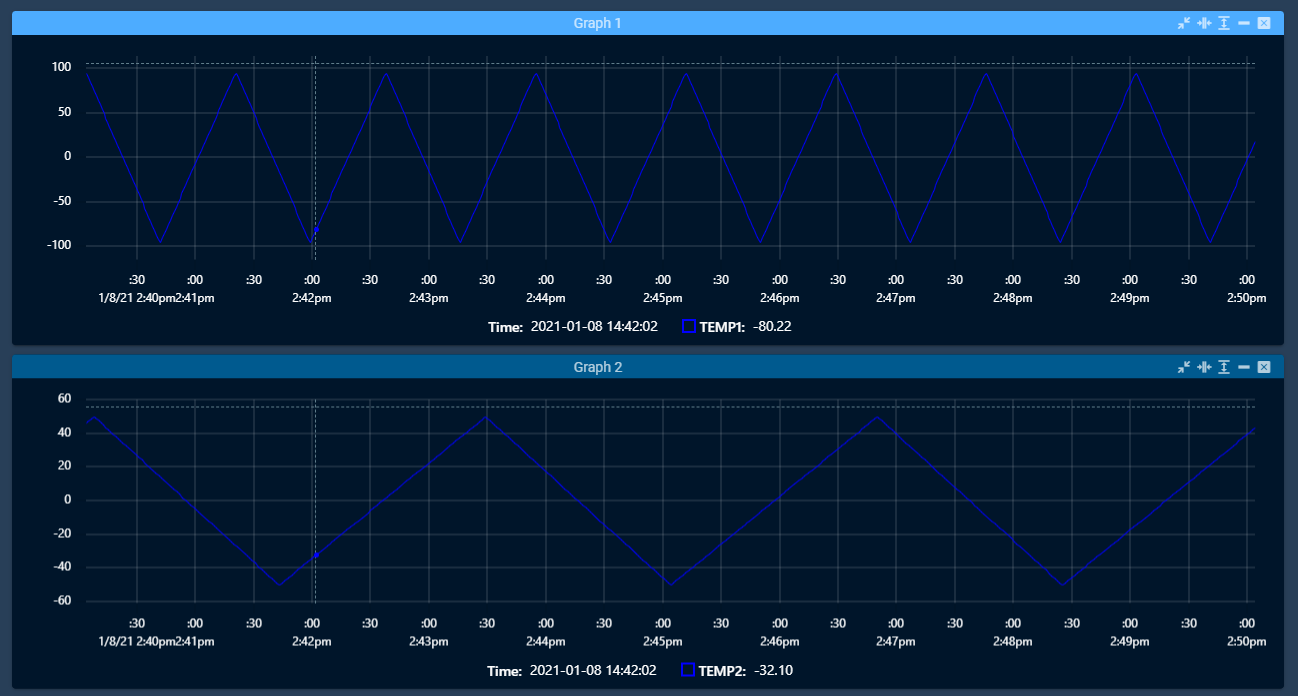
Selecting a target from the Select Target drop down automatically updates the available packets in the Select Packet drop down which updates the available items in the Select Item drop down. Clicking Add Item adds the item to the graph which immediately begins graphing.
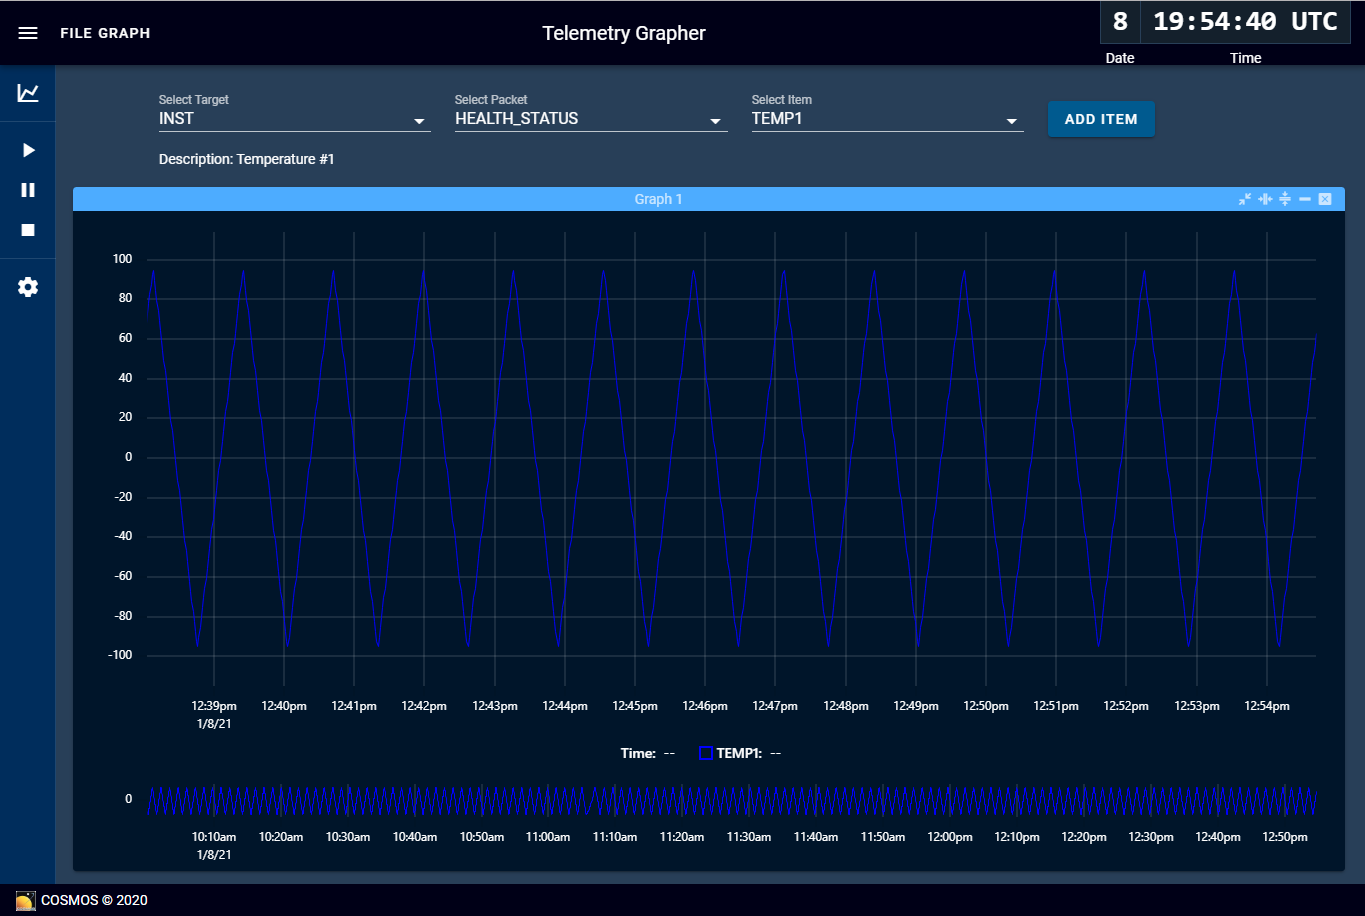
As time passes, the main graph fills up and starts scrolling while the overview graph at the bottom shows the entire history.
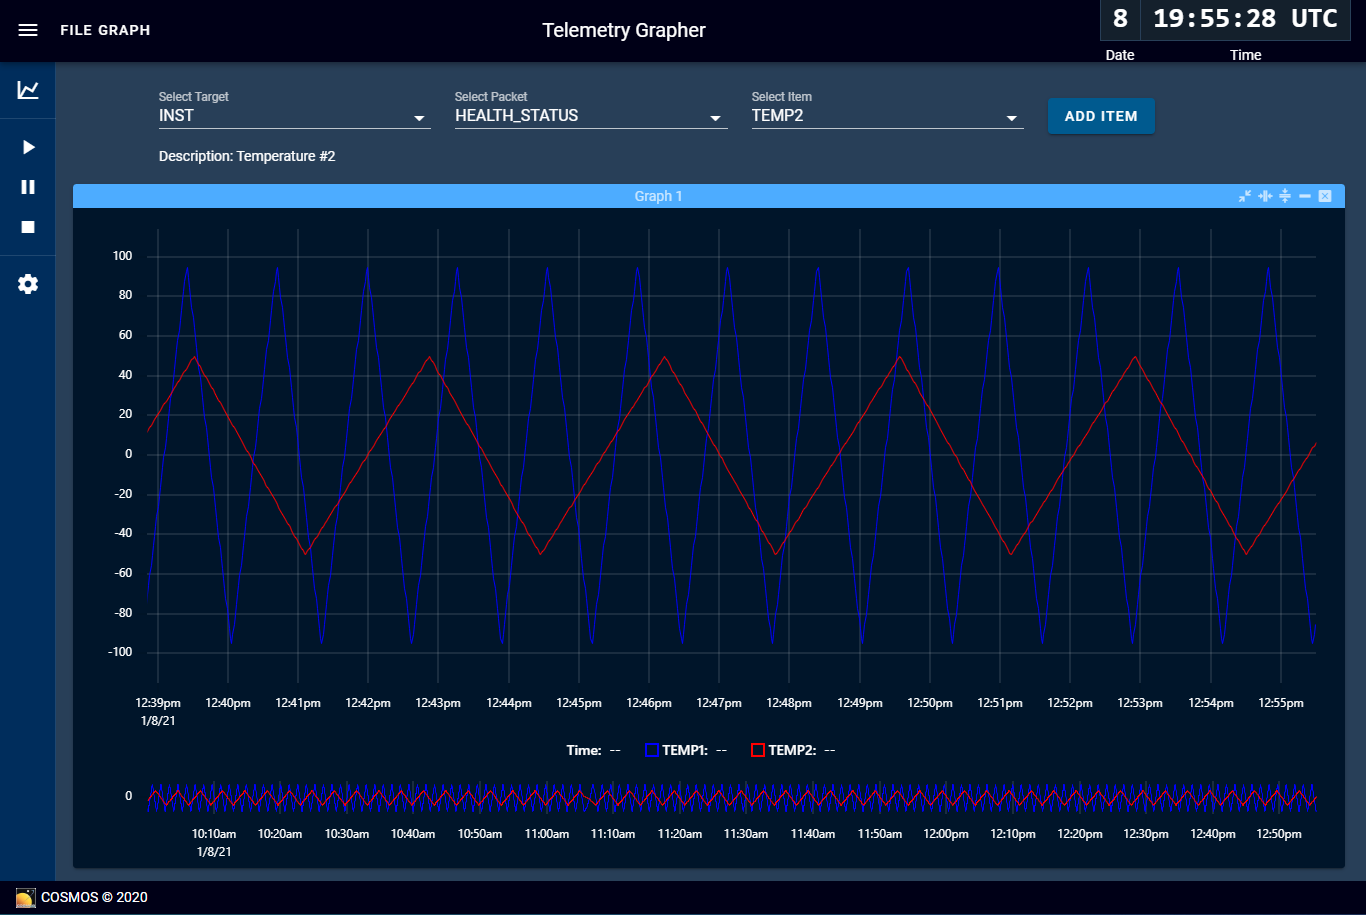
Selecting a new item and adding it to the graph automatically fills the graph with history until the beginning of the first item. This allows you to add items to the graph incrementally and maintain full history.
Graph Window Management
All graphs can be moved around the browser window by clicking their title bar and moving them. Other graphs will move around intelligently to fill the space. This allows you order the graphs no matter which order they were created in.
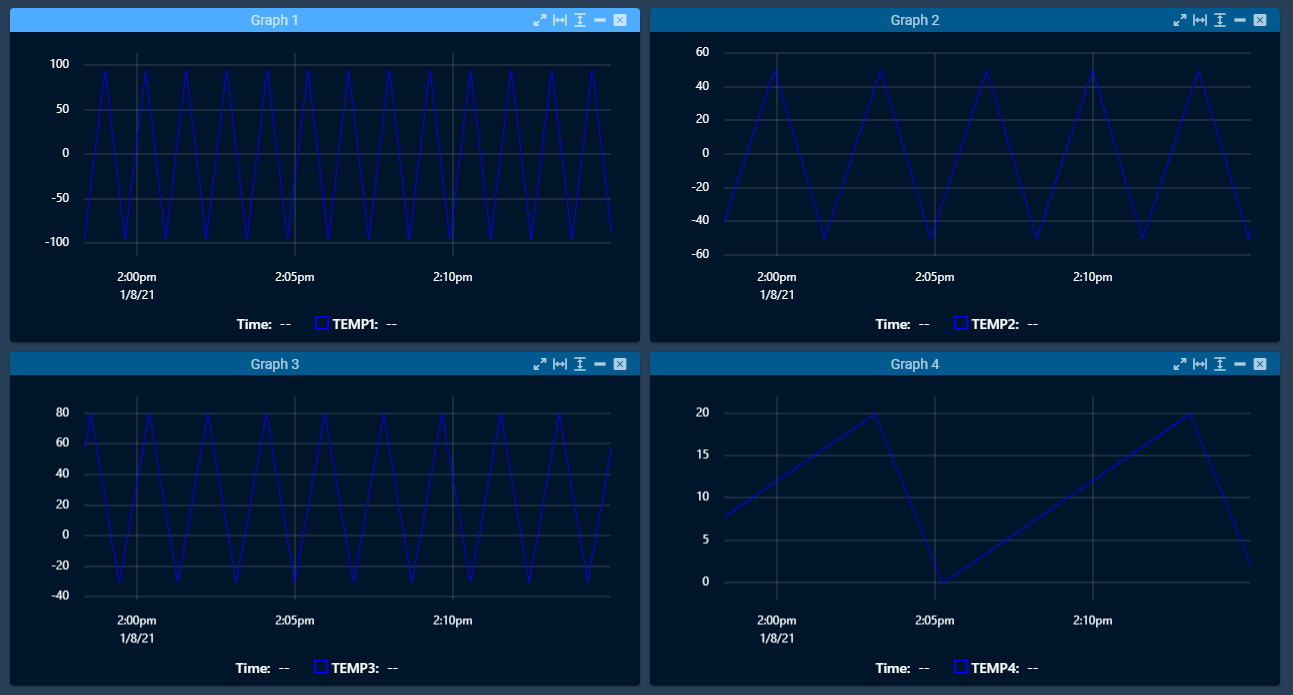
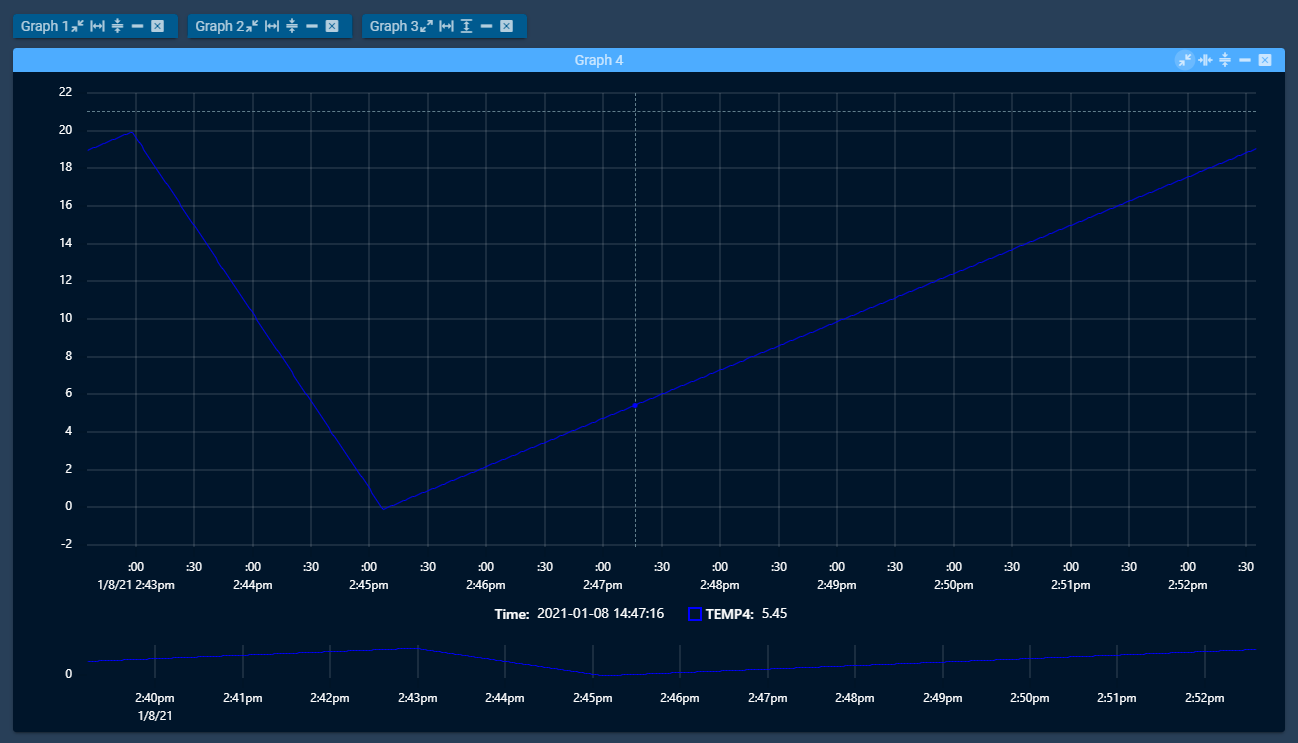
Each graph has a set of window buttons in the upper right corner. The first shrinks or grows the graph both horizontally and vertically to allow for 4 graphs in the same browser tab. Note that half height graphs no longer show the overview graph.
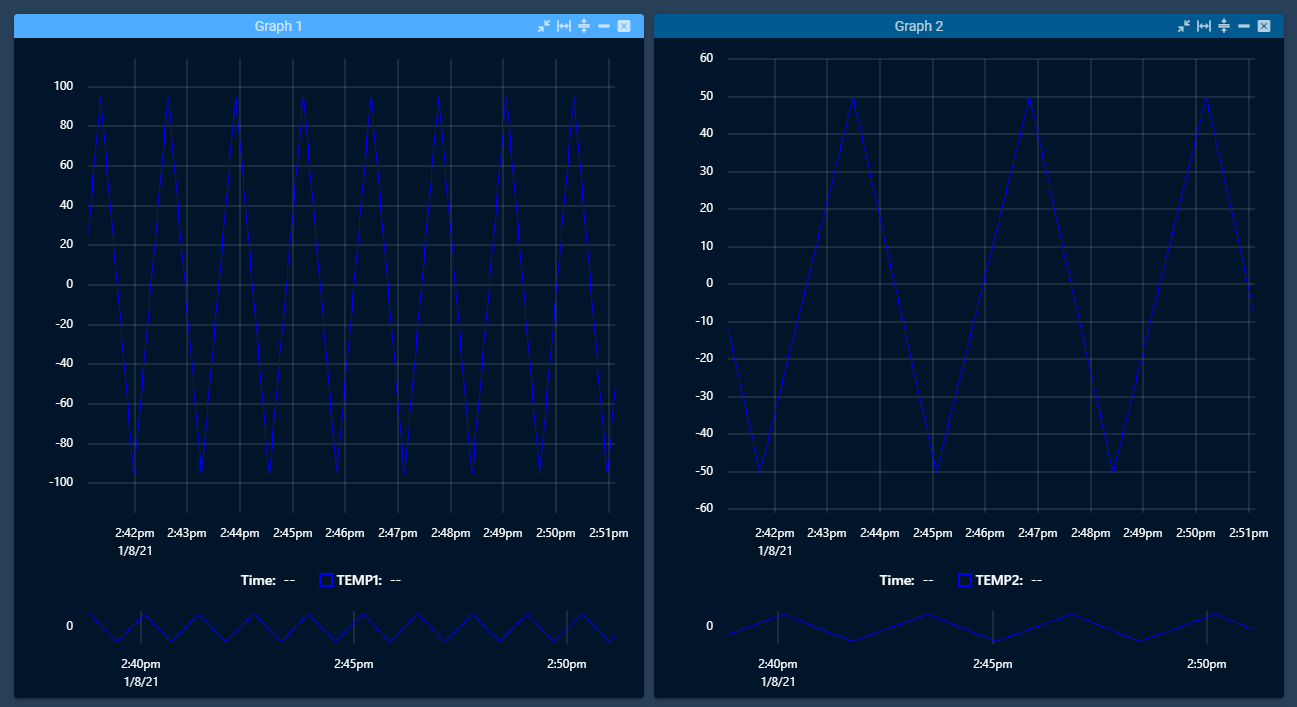
The second button shrinks or grows the graph horizontally so it will either be half or full width of the browser window. This allows for two full width graphs on top of each other.
The second button shrinks or grows the graph vertically so it will either be half or full height of the browser window. This allows for two full height graphs side by side.
The line button minimizes the graph to effectively hide it. This allows you to focus on a single graph without losing existing graphs.
The final X button closes the graph.
Grapher Controls
The left side of Telemetry Grapher contains a drawer that expands when moused over. These control the overall operation of Telemetry Grapher.
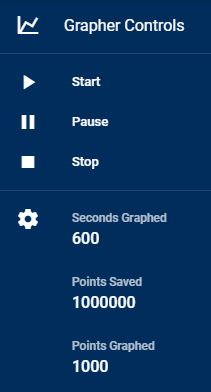
- Start a paused or stopped graph
- Pause the graph (continue to receive updates)
- Stop the graph (disconnect)
- Number of seconds graphed
- Total telemetry points kept in memory
- Number of points to graph
Changing the Points Saved will affect performance of the browser window if set too high. The default of 1,000,000 points can store over 11.5 days of 1Hz data points.
The smaller of Seconds Graphed and Points Graphed will be used when calculating the number of points to display.
While the graph is paused it continues to receive updates. The Stop button disconnects Telemetry Grapher from the backend and no longer receives data. If you Start again there will be a gap where no data was received.